June 12, 2014 at 9:35 p.m.
Survey: voters rate economic conditions as ‘only fair’
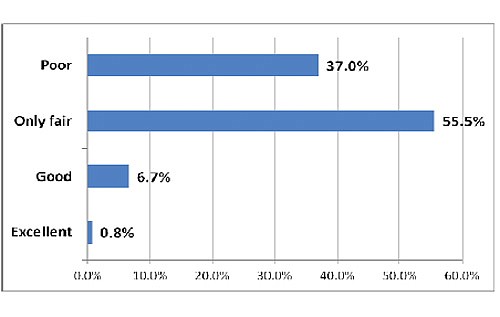
More than half of all voters (55.5%) rate current economic conditions as only fair, while nearly 4 in 10 (37%) rate them as poor, in a Profiles of Bermuda survey. Less than 1 in 10 voters (7.5%) rate economic conditions as either good or excellent. When asked to compare current conditions to conditions that existed a year ago, more than 4 in 10 voters (42.9%) stated that conditions had remained the same. One-third (32.3%) felt that conditions had worsened, while nearly one quarter of voters (23.7%) felt that economic conditions had improved.
Differences by Race
More than 7 in 10 (70.8%) of those who classified themselves as “Other” (other than black or white) were more inclined to say that conditions were only fair. Just over half of all white voters (54.4%) also felt that conditions were only fair, as well as a similar amount of black voters (53.8%). Black voters were also more likely to say that conditions had worsened (41.1%).
When comparing conditions to the previous year, 4 in 10 white voters believed that conditions had improved (40.7%), while a similar amount of black voters (43.9%), felt that conditions had worsened.
Differences by Income
Voters living in households earning more than $100,000 per year (33.7%) were likely to feel that economic conditions had improved compared to last year. However, 4 in 10 of those living in households that earned between $50,000 and $100,000, and those earning less than $50,000, felt that economic conditions had worsened (40% and 38.8% respectively).
Differences by Gender
While male voters were likely to feel that compared to last year economic conditions had improved (30.8%), female voters were more likely to feel that conditions had worsened (37.9%).
In general, how would you rate economic conditions in Bermuda today?
Compared to last year this time, would you say that economic conditions have improved, stayed the same, or got worse?
Notes: The survey was conducted among 375 voters between 20MAR14 and 18 MAY 14 and has a margin of error of plus or minus 5%. Some 69% of respondents were obtained by landlines, 24% by cell phones and 7% via the internet. Data for all demographics were weighted to reflect the 2010 Census. Totals in the charts may exceed 100% due to rounding.

Comments:
You must login to comment.